The heartbeat of our logs
Logentries draws a neat linechart to visualize your logging activity. This chart is great for seeing if there are any errors appearing after a change, so you see at a glance if it’s worth to check the logs. Looking at one of our services, this chart caught my eye:

At first sight this doesn’t say very much apart from the fact that there are large bumps appearing at every 2 minutes (that’s the frequency of the vertical lines). Regarding the other bumps there’s not much we can say as they kind of blend in and it’s hard to tell what’s going on. Are they random or periodic too?
So i became curious and downloaded a 60 minute long log file to analyse.
library(ggplot2)
library(data.table)

c <- read.csv("2016-04-04_181041_2016-04-04_191041.log", header=FALSE, sep = " ")
# We only need the timestamps of the logs
c <- c[,3]
c <- as.POSIXct(strptime(c, format="%Y-%m-%dT%H:%M:%OS", tz="GMT"))
# log span is ca. 60 minutes
span <- tail(c, n=1) - head(c, n=1)
I create a histogram with 10 second breaks (i.e 6 bin/minute)
breaks <- floor(as.numeric(span, units="secs")/10)
x.time <- hist(c, plot = FALSE, breaks=breaks)
And apply Discrete Fourier Transform to the bins to get the frequency components:
x.freq <- fft(x.time$counts)

spectrum <- function(X.k) {
  plot.data <- data.table(bin=0:(length(X.k)/2-1), amp=head(Mod(X.k), n=length(X.k)/2))
  plot.data[2:.N, amp:=2*amp]

  plot.data[bin>0] # Filter out the DC component
}

spectrum <- spectrum(x.freq)

ggplot(spectrum, aes(x=bin, y=amp)) + geom_bar(stat="identity")
Error in file(con, "rb"): cannot open the connection
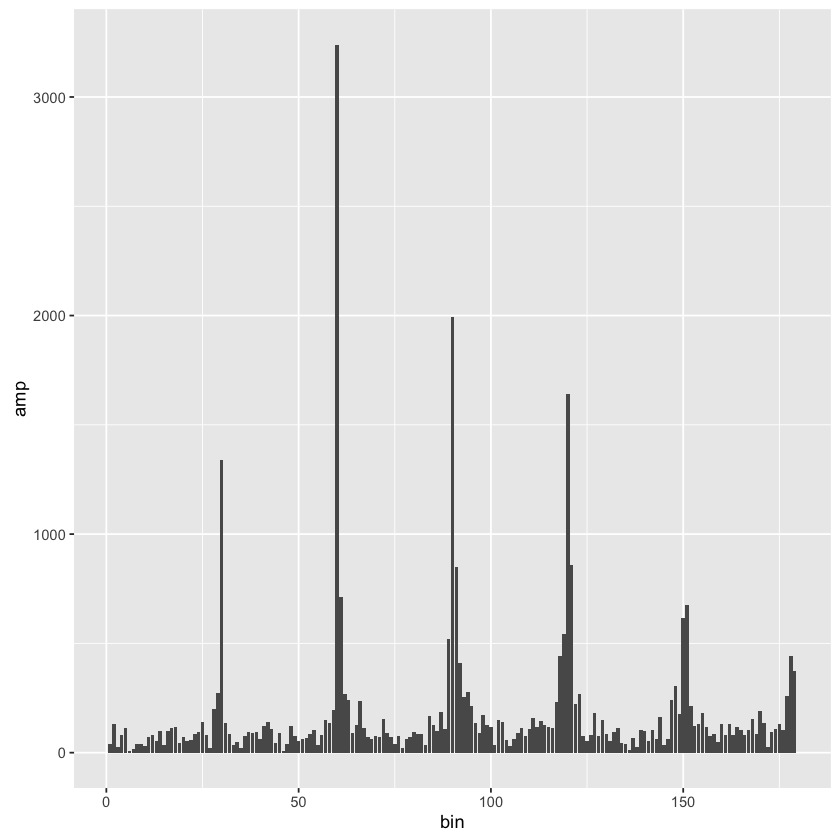
Wow! The periodicity is so apparent it nearly gauges your eyes! But what are the exact frequencies?
Let’s filter the peaks:
spectrum[amp>1000]
| bin | amp |
| 30 | 1338.389 |
| 60 | 3240.003 |
| 90 | 1994.452 |
| 120 | 1642.245 |
Multiples of 30 bins! That is…
freq.minutes = 6
1/((30*freq.minutes)/length(x.freq))
2.00555555555556
That is very interesting. We found a base frequency of 2 minutes with a significant amplitude. That means the traffic to our service is indeed very periodic, not random.